Introduction
High-cost chronic conditions, multi-comorbidity cases, and value-based care arrangements are no longer edge cases for health plans and rural healthcare organizations. Complex claims are now the center of healthcare finance.
PwC reports that 50-70% of payer medical expense payments now flow through non-claims financial arrangements (NCFAs), with traditional fee-for-service now representing the minority of payments. Meanwhile, the top 5% of spenders account for 49.7% of all healthcare expenditures, averaging $67,321 per capita.
Standard claims adjudication systems fail here. Built for fee-for-service simplicity, they lack flexibility for diverse contract terms and produce fragmented data across siloed systems. The result: duplicated payments, missed reconciliations, and forecast-to-actual misses that expose organizations to significant financial risk.
Rural healthcare organizations carry additional exposure. Provider shortages drive delayed care that converts into higher-acuity, higher-cost encounters — making proactive complex claims analytics a financial survival requirement, not a strategic option.
This article covers the analytics types best suited to complex claims, best practices for identifying and managing high-cost claimants, the KPIs that drive accountability, and the data infrastructure needed to execute effectively—with specific attention to the constraints and opportunities facing rural healthcare organizations.
TLDR
- Complex claims cover high-cost multi-condition cases and value-based contracts that standard adjudication systems can't handle
- Predictive and prescriptive analytics deliver the highest ROI by flagging future high-cost claimants before costs escalate
- Comorbidity combinations like diabetes + depression drive 4.5x greater costs than single conditions alone
- KPI tracking, data governance, and HIPAA-compliant infrastructure are non-negotiable foundations for complex claims programs
- Rural organizations can leverage outsourced AI-native data infrastructure to close the analytics gap without large IT teams
What Are Complex Claims — and Why Standard Analytics Falls Short
Complex claims in healthcare extend beyond clinical complexity to include financial complexity. Clinically, they involve high-acuity, multi-condition cases such as cancer, heart disease, complex childbirth, and chronic comorbidities requiring coordinated care across multiple specialties. Financially, they include non-claims financial arrangements (NCFAs), value-based care shared-risk contracts, performance-based incentives, and specialty payment models that fall outside traditional fee-for-service adjudication.
PwC observes that many payers now see 50-70% of medical expense payments flowing through NCFAs, with fee-for-service now representing the minority. NCFAs include shared risk arrangements, performance-based incentives, fixed fee-based payments, per-engaged-member-per-month (PEPM) payments, and group charges for programs such as fitness or diabetes management.
Why standard claims systems fail:
Standard adjudication systems were architected for fee-for-service simplicity. They process claims sequentially, apply fixed rules, and assume standardized payment structures. When organizations layer complex payment arrangements on top of these legacy platforms, failure modes emerge:
- Duplicate quality incentive payments create direct financial loss when service overlaps go undetected
- Forecast-to-actual variances widen without real-time visibility into financial exposures
- Fragmented data systems prevent unified tracking across payment models
- Manual spreadsheet processes generate redundant workflows and reconciliation errors
- NCFA contracts managed as one-offs rather than integrated into enterprise analytics
The disproportionate financial impact:
AHRQ's Medical Expenditure Panel Survey finds that the top 5% of spenders account for 49.7% of all healthcare expenditures, with per-capita costs averaging $67,321 in 2022. The top 1% alone account for 21.7% of total spending, averaging $147,071 per person. Among adults in the top 5% expenditure tier, 75.1% had two or more priority conditions.
That concentration has a direct implication for analytics strategy: a cohort representing 5% of patients drives nearly half of all spending. Organizations that identify and actively manage this group can achieve cost reductions that broad-based interventions simply cannot match.
The Four Types of Healthcare Analytics and Their Role in Complex Claims
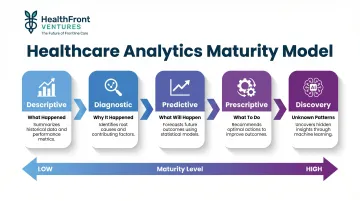
Healthcare analytics progresses through four distinct maturity levels—descriptive, diagnostic, predictive, and prescriptive—with a fifth type, discovery analytics, uncovering unknown patterns using machine learning. Each type plays a specific role in complex claims management, and the value compounds as organizations apply them together.
The analytics progression:
- Descriptive analytics — Reviews historical data to identify patterns and trends; answers "what happened" but does not address causation
- Diagnostic analytics — Identifies relationships and root causes to determine "why it happened"
- Predictive analytics — Uses historical data and statistical modeling to forecast future outcomes
- Prescriptive analytics — Recommends specific actions based on diagnostic and predictive insights to achieve optimal decisions
- Discovery analytics — Uncovers previously unknown patterns without predefined hypotheses using machine learning
How Descriptive and Diagnostic Analytics Form the Foundation
Descriptive analytics establishes baseline cost patterns, claim frequency, and utilization trends among complex claimants. Common questions it answers include:
- What percentage of members are high-cost claimants?
- How has that figure shifted over the past three years?
- What is the average claim cost for members with three or more chronic conditions?
From there, diagnostic analytics identifies which diagnoses, comorbidities, or contract types are driving cost spikes. It reveals prior authorization gaps, flags provider groups with the highest denial rates, and shows how specific NCFA contract terms correlate with forecast variances—giving teams a clear target for intervention.
How Predictive and Prescriptive Analytics Deliver the Highest Value
Predictive models flag which members are likely to become high-cost claimants, which claims are likely to be denied, and which value-based contracts are at financial risk. A meta-analysis of Medicare discharges found that avoiding a single excess 30-day readmission yields reimbursement gains of $10,000 to $58,000, with mean readmission costs of $16,037. Predictive readmission models let organizations direct care management resources to the highest-risk patients before discharge—before the cost is incurred.
Prescriptive analytics moves from insight to action: assign a case manager to patient ID 12345, renegotiate the shared-risk threshold in contract X, implement a pre-authorization workflow for procedure code Y. Each recommendation maps directly to an operational step, so analysis produces decisions rather than reports.
Identifying High-Cost and High-Complexity Claimants Before Costs Escalate
High-cost claimants are not randomly distributed—they cluster around chronic conditions and comorbidities. Predicting which members will become or remain high-cost requires looking beyond a single primary diagnosis to combinations of conditions. Research shows that patients with diabetes plus depression incur 4.5 times greater expenditures than those with diabetes alone. Similarly, Medicare beneficiaries with four or more conditions face costs 1,110.8% higher than single-condition patients.
Multi-Year Trend Analysis Reveals Persistent Cost Patterns
Analyzing multi-year patterns in claim costs, service utilization by site of care (inpatient, pharmacy, outpatient), and member transitions between cost tiers enables organizations to identify both recurring high-cost claimants and members at rising risk.
Approximately 75.8% of high-need high-cost patients follow persistent cost trajectories over five years — with 44% remaining in the very-high-cost category (average five-year cost of CAD $124,622 in Canadian research data) and 31.8% in the persistent high-cost category (CAD $38,997). Only 6.8% experience temporary cost spikes. That persistence means one-year snapshots consistently understate the value of sustained care management.
How Comorbidity Analytics and Diagnostic Groupers Work
Chronic Condition Hierarchical Groups (CCHGs) and similar diagnostic groupers let organizations monitor multiple simultaneous conditions per member and understand how comorbidity burden correlates with future claim complexity.
The CMS-HCC risk adjustment model maps ICD diagnoses to Hierarchical Condition Categories using concurrent models, where current-year diagnoses predict current-year expenditures. HCCs are selected based on empirical cost-predictiveness — excluding vague or non-significant diagnoses. Individual risk scores combine demographic factors (age/sex) and health factors (diagnoses), calibrated across approximately 45.2 million individuals.
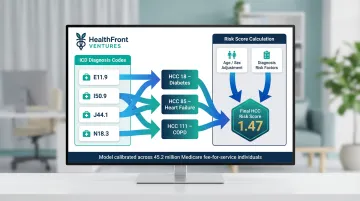
This granular view lets care managers intervene earlier — assigning resources to members with diabetes + depression combinations rather than treating all diabetes patients uniformly.
The Rural-Specific Challenge: Access Gaps and Delayed-Care Claims
In rural healthcare settings, care access gaps driven by provider shortages mean complex claims can emerge suddenly because patients delayed care. HRSA reports that 63.1% of designated primary care Health Professional Shortage Areas (HPSAs) are in rural areas, with 7.2% of U.S. counties having no primary care physician at all in 2023.
Without intervention, the gap is projected to widen: physician adequacy by 2038 is estimated at 83% for metro areas versus just 61% for nonmetro areas.
That shrinking workforce translates directly into claims complexity. Rural Medicare beneficiaries have 49% higher odds of emergency department visits and 60% higher ambulatory care-sensitive condition (ACSC) ED rates than urban counterparts. ACSCs are conditions where timely primary care access should prevent emergency presentations — elevated rural ACSC ED rates signal delayed care converting into higher-acuity, higher-cost encounters.
Workforce and access data, such as that provided by tools like HealthFront Baseline™ — which tracks rural HCP workforce metrics at the county level — can help rural health organizations understand whether provider availability gaps are contributing to delayed-care-driven claim complexity in their service areas.
Practical Steps for Early Identification
- Segment the population by risk tier — Classify members as low, rising, high, or highly complex based on historical cost patterns and comorbidity burden
- Assign case management resources proportionally — Allocate intensive case management to the top 5% of predicted spenders, moderate support to the next 10%, and self-service tools to low-risk members
- Set early intervention triggers — Define thresholds such as three or more ER visits in six months, unfilled specialty referrals, or prescription non-adherence flags that automatically prompt case manager outreach
- Monitor transitions between tiers — Track members moving from low to rising risk, enabling proactive intervention before they reach high-cost status
Best Practice Analytics Strategies for Managing Complex Claims
Centralize data and establish a unified claims data architecture
Fragmented, siloed data is the most commonly cited barrier to effective complex claims management. Organizations should build or procure a centralized data repository that unifies medical claims, pharmacy claims, and—for value-based care organizations—NCFA financial data. This enables consistent tracking across all payment models, eliminating reconciliation errors that arise when fee-for-service claims, shared-risk settlements, and performance incentive payments are managed in separate systems.
A unified architecture also enables longitudinal member tracking, linking claims across years to identify persistent high-cost patterns and measure intervention effectiveness over time.
Automate reconciliation and reduce manual processes
Manual spreadsheet-based workflows for tracking NCFAs, shared-risk calculations, or stop-loss thresholds introduce reconciliation errors and delay financial decision-making. PwC documents that manual NCFA processes using disparate systems and spreadsheets create redundant operational inefficiencies, with heightened risk of financial loss and duplication.
Automation of settlement, reporting, and accrual workflows reduces errors and frees analysts for higher-value interpretation work. Integrated platforms narrow forecast-to-actual gaps by giving finance teams current exposure data across all payment models — not just a quarterly snapshot.
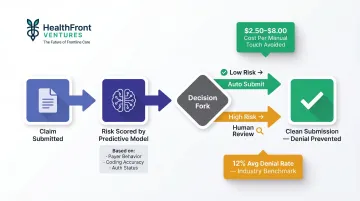
Build predictive denial management into the pre-submission workflow
The national average denial rate reached 12% in 2023, with 84% of denials potentially avoidable. Many of these denials trace back to eligibility errors, coding mismatches, or prior authorization gaps — all catchable before submission.
Predictive models score claims for denial risk based on historical payer behavior, coding patterns, and authorization status. The system routes high-risk claims for human review before submission — preventing denial costs ($2.50 to $8.00 per manual touch) and accelerating revenue cycle timelines.
Use comorbidity-informed care management to reduce downstream claim volume
Proactive case management—coordinating transitions of care, supporting medication adherence, and preventing avoidable readmissions—directly reduces the frequency and cost of future complex claims. Analytics should feed case managers with current alerts, not static quarterly reports.
For example, when a diabetic patient with depression misses two consecutive endocrinology appointments and fills no prescriptions in 60 days, an automated alert triggers case manager outreach. This intervention prevents progression to diabetic ketoacidosis requiring hospitalization—avoiding a $20,000+ inpatient claim and improving patient outcomes.
Implement cross-functional governance for NCFA and value-based arrangements
Complex payment arrangements require collaboration across procurement, care management, finance, and clinical leadership. A formal governance model keeps these functions aligned. Monthly governance reviews should cover:
- Forecast-to-actual variance across all payment models
- NCFA contract term compliance and performance incentive attainment
- Contract performance risks requiring escalation
- Process improvements authorized for the next reporting cycle
Without this structure, analytics outputs accumulate in dashboards that no one acts on — and financial exposure grows unnoticed.
KPIs That Drive Accountability in Complex Claims Analytics
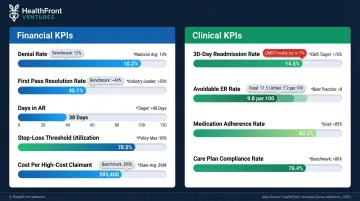
Primary financial and operational KPIs
Core metrics for complex claims programs:
- Denial Rate — Percentage of claims rejected by payers; industry average reached 12% in 2023, up from 9% in 2016
- First Pass Resolution Rate — Percentage of claims paid correctly on first submission; industry zero-touch rate averages approximately 40%
- Days in Accounts Receivable — Average time from claim submission to payment receipt; tracks revenue cycle efficiency
- Stop-Loss Threshold Utilization Rate — Percentage of expected stop-loss threshold consumed; monitors exposure to catastrophic claims
- Cost Per High-Cost Claimant — Average annual cost for top 5% of spenders; tracks whether interventions are bending the cost curve
Clinical outcome KPIs tied to complex claims
Clinical outcome KPIs serve as leading indicators that predict future claim complexity. When organizations improve these clinical metrics, financial claims KPIs typically follow within 1-2 reporting periods.
Key clinical indicators:
- 30-day readmission rate — CMS HRRP imposes penalties up to 3% of total reimbursement; mean readmission cost is $16,037
- Avoidable ER utilization rate among high-cost members — Rural: 11.5 per 100 versus urban: 7.2 per 100 for ACSC-related visits
- Medication adherence rates — Non-adherence predicts disease progression and future high-cost episodes
- Care plan compliance rates — Percentage of high-risk members actively engaged in case management programs
The importance of baseline benchmarking
Measuring the right KPIs is only half the equation — those numbers only become actionable when compared against a reliable baseline. Organizations without documented baselines cannot tell whether performance is genuinely improving or simply fluctuating.
For rural healthcare organizations, county-level or regional benchmarks matter far more than national averages. National figures reflect urban provider density and access patterns that simply don't translate to rural settings. HealthFront Baseline™ addresses this directly, providing rural-specific HCP workforce metrics at the county level so organizations can benchmark against comparable geographies rather than misleading national norms.
Building a Compliant, Data-Ready Foundation for Complex Claims Analytics
HIPAA compliance and de-identification requirements
Complex claims data often involves highly sensitive multi-condition patient records, making robust de-identification and access controls required by law and essential for patient trust. The HIPAA Safe Harbor method requires removal of 18 specific identifiers, including names, geographic subdivisions smaller than state (except ZIP code first three digits if population exceeds 20,000), all date elements except year, telephone numbers, Social Security numbers, medical record numbers, and any other unique identifying characteristic.
However, research demonstrates that 25% of participants were uniquely and correctly identified by name in HIPAA Safe Harbor-compliant data when exact birth year—permitted under Safe Harbor—was included. In small communities of approximately 3,000 adults, 90% of properties had unique combinations of physical characteristics enabling linkage.
Implication for complex claims: Multi-condition records with rare diagnosis combinations in small geographic areas (especially rural) present elevated re-identification risk even after standard Safe Harbor de-identification. Advanced statistical anonymization or expert determination methods may be needed to prevent re-identification through rare diagnosis/location combinations.
Data quality as the foundational prerequisite
Inaccurate coding, missing diagnosis-procedure linkages, and inconsistent member identifiers across systems will corrupt any predictive model built on top of them. Primary diagnosis error rates of 26.8% and secondary diagnosis Cohen's Kappa of only 0.12 have been documented in recent studies, with emergency room coding having the highest error incidence.
Organizations must implement data validation routines at ingestion—before analytics workflows consume the data—to prevent "garbage in, garbage out" outcomes. Validation should include:
- Flag claims where procedure codes do not clinically align with their associated diagnosis codes
- Reconcile member IDs across medical, pharmacy, and eligibility systems to close identity gaps
- Reject claims where service dates precede birth dates or follow recorded death dates
- Identify and resolve duplicate claim submissions before payment processing reaches downstream systems
Infrastructure options for rural healthcare organizations with limited data capacity
Meeting the data quality standards described above requires infrastructure most rural health systems simply don't have in-house. Building and maintaining custom analytics pipelines demands engineering capacity that smaller organizations rarely carry.
Outsourced, AI-native data warehouse solutions—such as HealthFront Ventures' AI-Native HCP Workforce Data Warehouses—handle the full claims data lifecycle, from acquisition and normalization through analytics-ready output, without requiring internal data engineers. Rural organizations receive pre-processed, standardized data instead of raw claims files, freeing their limited IT staff to focus on operational support rather than pipeline maintenance.
Frequently Asked Questions
What are complex claims in healthcare?
Complex claims fall into two categories. Clinically, they involve high-acuity multi-condition cases — cancer, complex childbirth, chronic comorbidities. Financially, they include value-based care shared-risk contracts and non-claims financial arrangements (NCFAs) that fall outside standard fee-for-service adjudication. Both require analytics beyond traditional claims processing systems.
What is an example of a complex claim?
A patient with diabetes and heart failure requiring multi-specialty care coordination generates layered claims across inpatient, pharmacy, and outpatient settings — each with multiple ICD-10 codes. That same patient may also trigger shared-risk performance settlements under value-based contracts alongside standard claims.
What is claims analytics?
Claims analytics is the systematic use of descriptive, predictive, and prescriptive data analysis to identify patterns in billing and treatment data, enabling healthcare organizations to reduce denials, manage costs, improve care quality, and detect fraud or billing errors.
What are the four types of data analytics in healthcare?
The four core types are:
- Descriptive: Summarizes what happened
- Diagnostic: Identifies why it happened
- Predictive: Forecasts what will happen
- Prescriptive: Recommends actions to take
A fifth type — discovery analytics — uses machine learning to surface patterns that weren't previously known to exist.
What are the 5 key performance indicators in healthcare?
Commonly tracked KPIs include:
- Claim denial rate
- First pass resolution rate
- Days in accounts receivable
- 30-day readmission rate
- Cost per high-cost claimant
Establish a baseline before measuring improvement — otherwise it's difficult to separate real performance gains from statistical noise.
What are the top 5 denials in medical billing?
The most common denial categories are missing or invalid patient information, duplicate claim submissions, services not covered or not medically necessary, prior authorization not obtained, and coding errors (mismatched diagnosis-procedure pairs). Predictive analytics can flag most of these before submission.