Claims analytics represents the shift from reactive damage control to proactive denial prevention. Instead of chasing denials after the fact, providers use data to identify why claims fail, which payers deny most frequently, and what changes will improve outcomes before submissions leave the building.
This article covers what claims analytics is in the context of denial management, why denials are escalating across the industry, how analytics targets root causes through three analytical layers, a step-by-step workflow you can implement, and a practical walkthrough showing how a rural clinic uses data to cut denials systematically.
Key Takeaways
- Claims analytics applies data analysis tools to identify, prevent, and resolve denied claims before and after submission
- Providers lost $48.4 billion to revenue leakage in 2025, with research showing 84% of denials are potentially avoidable
- Analytics works across three layers — past denial root causes, pre-submission risk flagging, and prioritized appeals — to address denials at every stage
- The full workflow spans data aggregation, pattern identification, pre-submission scrubbing, real-time alerts, and feedback loops that improve over time
- Rural providers face compounded denial risks due to staffing constraints and documentation gaps, where data-driven denial management often determines financial viability
What Is Claims Analytics in the Context of Denial Management?
Claims analytics is the systematic collection and analysis of billing data to identify patterns in claim submissions, rejections, and payments. Denial management is one of its highest-impact applications for providers struggling to maintain revenue cycle performance.
Unlike basic billing software that simply processes claims, analytics interrogates them. It asks why certain claims fail, which payers deny most frequently, and which codes or providers trigger the highest rejection rates. That distinction has real consequences: providers relying on processing alone have no visibility into patterns driving denials — and no path to systematically reducing them.
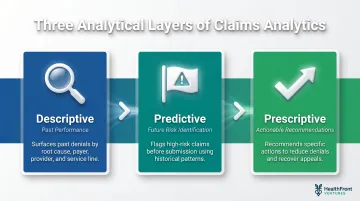
Claims analytics operates across three analytical layers relevant to providers:
- Descriptive: Surfaces what has already been denied and why — broken down by root cause, payer, provider, and service line
- Predictive: Flags claims likely to fail before submission, based on historical patterns and payer-specific risk factors
- Prescriptive: Recommends the specific actions that reduce denial rates and recover revenue from appeals
These layers work together to transform raw billing data into concrete intelligence billing teams can use — preventing denials before they occur and recovering revenue from those that reach the appeals stage.
Why Claim Denials Are Escalating for Providers
Initial denial rates hit 12% in 2023 — up from 9% in 2016 — across 124 million hospital claims analyzed. That trajectory held across provider types: 60% of practice leaders reported rising denials in early 2024 compared to the previous year.
The cost runs deeper than lost revenue. Beyond the $48.4 billion in missed reimbursements, providers spent $25 billion fighting claim denials in 2023 — $18 billion of it disputing claims that should have been paid at first submission.
Most Common Root Causes
Research analyzing hospital claims in 2023 identified the top denial drivers:
- Registration and eligibility issues: 24.33% of all denials
- Missing or invalid claim data: 15.89%
- Authorization and precertification problems: 12.80%
- Medical documentation requested: 12.08%
- Service not covered: 9.67%
- Medical necessity: 6.76%
Front-end issues accounted for 44% of total denials, up from 41% in 2022. These are largely administrative failures — incorrect patient information, missing eligibility verification, incomplete documentation — and therefore addressable through better data processes rather than clinical changes.
The Compounding Burden on Rural Providers
Rural and smaller providers face these risks at greater scale. Thin billing teams, limited coding expertise, outdated systems, and high staff turnover mean denial errors go undetected longer.
The National Rural Health Association notes that rural hospitals "lack experienced personnel and the technology needed to optimize the revenue cycle," — a gap that drives 3-5% annual losses in net patient revenue for small hospitals.
Staffing shortages make it worse. Appeals go unworked as teams are stretched thin, and one analyst observed that "certain payers just deny a percentage of claims because they know analysts can't get them all appealed in time." For rural providers already on thin margins — 46% of rural hospitals operated at a loss in 2025 — unaddressed denials accelerate the path to closure.
How Claims Analytics Targets Denial Root Causes
The core function of claims analytics in denial management is root cause identification. Simply counting denials tells you something is wrong; categorizing them by type, payer, provider, service line, and time period reveals systemic patterns rather than isolated errors.
Payer-Specific Denial Intelligence
Different payers deny for different reasons and at different rates. Analytics allows providers to build payer-specific intelligence — knowing, for example, that a specific insurer consistently rejects a particular CPT code without a modifier, and adjusting all future submissions accordingly.
The result is billing adapted to each payer's actual behavior, not generic rule-following. Billing staff learn to account for specific patterns:
- Which payers require additional documentation for specific procedures
- Which codes trigger automatic medical necessity reviews
- Which modifiers prevent routine rejections
Predictive Denial Flagging
Analytics tools score incoming claims for denial risk before submission based on historical patterns. Billing staff can prioritize pre-submission review where it matters most, focusing time on high-risk claims rather than checking every submission equally.
Research shows that automated claim-scrubbing and predictive validation can prevent up to 85% of avoidable denials while reducing administrative cost per claim by nearly 25%. Catching denials before submission is also the most cost-effective intervention point in the entire revenue cycle.
Appeal Prioritization
Not all denied claims are worth appealing. The average cost to appeal a denied claim is $57.23. Analytics can calculate the dollar value and overturn likelihood of each denied claim, helping providers focus rework resources on the highest-ROI recoveries rather than working the queue chronologically.
Providers that apply analytics to appeal prioritization report significant improvements. Industry data shows that about 70% of denials are ultimately overturned on appeal, meaning most denials are administrative errors, not clinical rejections. The challenge is identifying which 70% to pursue when staff time is limited.
The Continuous Improvement Loop
Over time, data from denials feeds back into staff training, documentation protocols, and coding practices. The system gets smarter with each billing cycle. Billing teams build specific, actionable knowledge:
- Which provider documentation habits consistently trigger denials
- Which payers have recently changed their requirements
- Which service lines need workflow adjustments
This feedback loop is what separates proactive denial management from reactive firefighting. Organizations stop re-litigating the same denials each month and start eliminating their root causes. Denial rates fall not because staff work harder, but because the data shows them precisely where to focus.
The Claims Analytics Denial Management Workflow – Step by Step
Step 1: Aggregate and Standardize Claims Data
Pull claims data from EHRs, billing platforms, and payer remittance advice into a centralized repository. For most organizations, this is where the process breaks down first.
Inconsistent data formats, incomplete remittance codes, and siloed billing systems block analysis before it starts. One payer uses CARC code 16 for prior authorization, another uses code 197, a third uses free-text denial reasons. Standardizing these variations into consistent categories is non-negotiable.
Before that standardization is complete, no meaningful analysis can start.
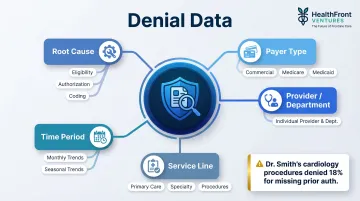
Step 2: Categorize and Segment Denials
Sort denials by root cause category, payer, provider, and service line. This segmentation makes the data actionable.
Create segments for:
- Root cause (eligibility, authorization, coding, documentation, timely filing)
- Payer (commercial, Medicare Advantage, traditional Medicare, Medicaid)
- Individual provider or department
- Service line (primary care, specialty, procedures)
- Time period (monthly trends, seasonal patterns)
Aggregate denial rates tell you something is wrong. Segmented data tells you exactly where and why. "Dr. Smith's cardiology procedures are denied at 18% for missing prior authorization" is actionable in a way that "our denial rate is 12%" is not.
Step 3: Identify High-Frequency Denial Patterns
Use descriptive analytics to identify the top denial drivers. Front-end issues account for 44% of denials, with registration and eligibility alone representing 24.33%. Most organizations discover that 3-5 recurring denial reasons account for the majority of rejected claims.
Targeting these systematically is the highest-leverage action available. If missing prior authorization causes 30% of your denials, fixing that one workflow eliminates nearly a third of your denial workload.
Step 4: Implement Pre-Submission Claim Scrubbing
Apply denial risk scoring and automated claim scrubbing to flag high-risk claims before they leave the billing department. This converts historical denial data into a real-time quality checkpoint.
Pre-submission scrubbing is the most cost-effective intervention in the entire workflow because it stops denials before they occur.
A claim flagged and corrected before submission costs minutes of staff time. The same claim denied, appealed, and resubmitted costs hours and delays payment by 30-60 days.
Step 5: Track, Appeal, and Close the Loop
Monitor denial overturn rates from appeals, track which appeal strategies work with which payers, and feed results back into the analytics model.
Closing the loop means:
- Recording why appeals succeeded or failed
- Updating prediction models with new denial patterns
- Training billing staff on newly identified causes
- Adjusting pre-submission edits based on appeal outcomes
Most providers skip this step entirely, treating each denial as an isolated incident. Organizations that close the loop convert appeal outcomes into updated prediction models, which means each denial cycle produces fewer denials in the next one.
Claims Analytics in Practice: A Rural Provider Walkthrough
A rural multi-specialty clinic noticed its denial rate climbed over six months, creating a cash flow problem. Leadership knew revenue was slipping but lacked clarity on why. Monthly billing reports showed "denial rate: 14%" without explaining what was driving the increase.
So the billing team ran a systematic analytics review — tracing denials from the source rather than reacting claim by claim.
12 months of claims pulled and standardized: The billing manager pulled 12 months of claims data from their EHR, billing clearinghouse, and payer remittance files into a spreadsheet. She standardized denial reason codes across payers, creating consistent categories.
Root causes by payer: When she segmented denials by root cause and payer, a clear picture emerged. Sixty percent of denied claims clustered around three issues:
- A specific commercial payer's authorization requirements for outpatient procedures had changed six months earlier — the same time denials started climbing
- One provider's inconsistent use of modifiers triggered medical necessity reviews
- An eligibility verification gap at intake meant patients who'd changed coverage weren't caught until after service
Implementation: With a clear picture of root causes, the clinic made targeted changes:
- Created a payer-specific authorization checklist for the commercial insurer, implemented at scheduling
- Worked with the provider to adjust coding workflow and modifier application
- Added real-time eligibility verification at scheduling instead of day-of-service
- Implemented pre-submission scrubbing that flagged high-risk claims based on historical patterns
Measurable results: The denial rate dropped from 14% to 9% over the following quarter. Days in accounts receivable decreased from 58 days to 51 days. Billing staff spent less time on rework and more time on first-pass submissions.
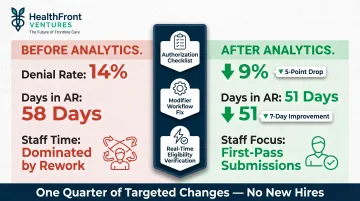
No new hires, no overtime. Three targeted process changes — each tied directly to a pattern the data revealed — recovered a meaningful share of previously lost revenue.
How HealthFront Can Help
While claims analytics requires clean, structured data and the analytical capacity to act on it, many rural providers lack the underlying data infrastructure to get there. HealthFront Ventures serves as a data infrastructure partner for rural healthcare organizations through workforce data solutions and HealthFront Baseline™ metrics that build the data foundation needed for effective revenue cycle management.
Workforce gaps are a root cause of denial problems. High provider and billing staff turnover, understaffed coding teams, and inconsistent credentialing all directly elevate denial rates. HealthFront addresses these retention and recruitment challenges through structured data — closing the upstream gap that fuels downstream billing failures.
HealthFront's outsourced data warehouse and lake solutions give rural organizations the analytical infrastructure they need — without custom builds. That foundation supports denial management by tracking:
- Workforce stability and provider retention trends
- Staffing benchmarks across rural HCP roles
- Operational visibility into billing and credentialing consistency
Frequently Asked Questions
What does a claims analyst do?
A claims analyst reviews billing data to identify errors, denials, and patterns in claim submissions. They work to improve clean claim rates, resolve denied claims through appeals, and implement process improvements that reduce future rejections.
What is patient claims data?
Patient claims data is the billing information generated by each healthcare encounter, including diagnosis codes, procedure codes, provider details, and payer information submitted to insurers for reimbursement.
What are the 4 phases of the claim process?
The four phases are claim submission, adjudication (payer review), remittance (payment or denial notice), and follow-up (appeals or rework). Analytics supports each phase — catching errors before submission, anticipating adjudication outcomes, and focusing follow-up where it matters most.
What is the golden rule in medical billing?
The golden rule is to submit clean claims the first time: accurate coding, complete documentation, and verified eligibility. First-pass resolution is the single biggest driver of revenue cycle efficiency.
What is an example of analytics in healthcare?
A provider uses historical claims data to identify that a specific payer consistently denies a procedure code without a particular modifier. The billing team updates submission templates to include the modifier automatically, preventing the denial before it occurs.