Introduction
Healthcare generates massive volumes of data every day — from electronic health records and insurance claims to real-time feeds from wearable devices and remote monitoring systems. Yet many clinical operations teams still make critical decisions about staffing, patient flow, and resource allocation based on instinct or habit rather than structured analysis.
That gap is sharpest in rural and mid-sized organizations. While large health systems have made analytics infrastructure standard practice, rural hospitals lag significantly behind metropolitan peers — adopting 29% fewer telehealth functionalities for stroke care and showing a 20-percentage-point gap in electronic data availability. The result is measurable inefficiency in workforce planning, patient flow, and financial performance.
This guide breaks down what healthcare analytics is, how it works across distinct operational stages, and where it creates real impact on clinical workflows. The focus is practical — the day-to-day operations that determine whether rural healthcare organizations stay financially viable.
Key Takeaways
- Healthcare analytics systematically collects and analyzes health data to support better clinical, operational, and financial decisions
- It moves through four stages: describing past patterns, diagnosing causes, predicting future conditions, and recommending action
- Key applications include staffing optimization, patient flow management, readmission reduction, and revenue cycle performance
- Organizations using analytics achieve measurable cost savings, improved care quality, and more efficient workforce utilization
- Implementation challenges center on data integration barriers, regulatory compliance, and clinical staff adoption
What Is Healthcare Analytics?
Healthcare analytics uses quantitative and qualitative methods to systematically collect, process, and analyze data from EHRs, insurance claims, patient registries, wearable devices, and clinical surveys. The explicit goal is supporting evidence-based decisions in both patient care and operational management.
Healthcare organizations have historically operated on fragmented, siloed data and reactive decision-making models. Analytics fills this gap with proactive, evidence-backed planning — particularly critical as value-based care participation reaches 45.2% among hospitals and health plans, shifting reimbursement toward measurable quality and efficiency rather than volume.
It's worth distinguishing healthcare analytics from adjacent tools. Basic health IT reporting (raw EHR exports), generic BI dashboards, and administrative billing systems don't qualify. Meaningful analytics requires clinical context, validated data standards, and cross-system integration.
Five Core Types of Analytics
- Descriptive analytics: Summarizes what happened (e.g., average length of stay last quarter)
- Diagnostic analytics: Explains why it happened (e.g., identifying which patient characteristics correlate with longer stays)
- Predictive analytics: Forecasts what will happen (e.g., projecting next month's patient volume by day and shift)
- Prescriptive analytics: Recommends what action to take (e.g., suggesting optimal nurse-to-patient ratios based on forecasted demand)
- Discovery analytics: Surfaces previously unknown patterns (e.g., detecting unexpected correlations between medication combinations and readmission risk)
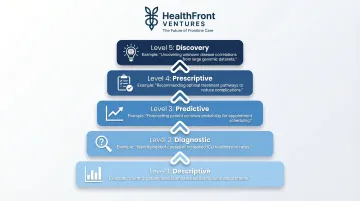
In practice, most healthcare organizations start with descriptive reporting and advance toward predictive and prescriptive models as their data infrastructure matures — which is exactly where clinical operations improvement begins.
How Healthcare Analytics Drive Clinical Operations
Healthcare analytics operates through a defined sequence of stages, each contributing a different layer of insight that clinical and operations leaders can act on — from raw data collection through real-time decision support.
Data Collection and Integration
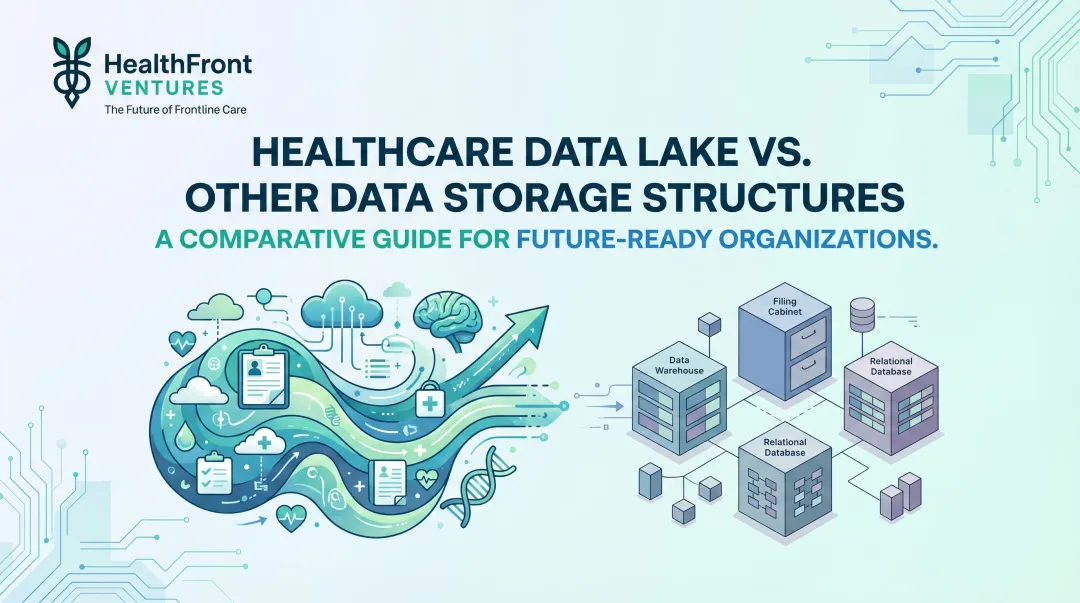
The process begins with ingesting both structured data (EHR records, claims, lab results, scheduling data) and unstructured data (clinical notes, patient surveys) from multiple systems into a centralized data warehouse or data lake.
Common bottlenecks at this stage:
- Inconsistent data formats across systems
- Interoperability gaps between different EHR platforms
- Incomplete data pipelines, especially in rural or resource-constrained settings lacking sufficient IT infrastructure
Rural hospitals demonstrate electronic data availability at just 64% compared to 84% for metropolitan peers, and only 72% of rural facilities can use electronic data from external providers versus 90% for urban hospitals. These gaps directly limit the foundation available for analytics.
Analysis and Pattern Recognition
The core analytical step applies descriptive and diagnostic methods to surface patterns invisible in raw data alone. This includes identifying:
- Patient readmission clusters by diagnosis, provider, or care pathway
- Provider productivity variances across clinical teams
- Appointment no-show rates by patient demographic or appointment type
- Equipment utilization imbalances across departments
These patterns map onto concrete operational variables: appointment scheduling efficiency, average length-of-stay by care pathway, and how clinical tasks are distributed across roles — giving leaders a specific diagnostic starting point rather than a general performance summary.
Predictive Modeling and Operational Forecasting
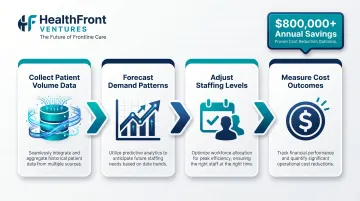
Predictive analytics uses historical operational patterns to forecast future conditions — patient volume fluctuations, seasonal demand spikes, and provider burnout or turnover risk signals. With those forecasts in hand, clinical operations teams can adjust staffing levels, modify scheduling blocks, and reallocate resources before demand outpaces capacity.
A data-driven staffing model implemented at UPMC across 11 hospitals reduced daily overtime and idle time, generating over $800,000 in annual cost savings by addressing fluctuating case volumes that make static staffing ratios inefficient.
When predictive models feed directly into clinical decision support tools, treatment protocol adherence improves — and variability in care delivery across providers decreases.
Output and Performance Monitoring
Analytics ultimately produces operational dashboards, KPI reports, and automated alerts that translate complex analysis into clear, actionable guidance for clinical leaders, care managers, and front-line staff.
The value of those outputs depends heavily on data timeliness. Dashboards built on stale data delay decisions; real-time or near-real-time feeds allow clinical teams to act on shifting conditions as they develop — not after the fact.
Operational areas most improved by timely analytics output:
- Patient wait time reduction through live queue and bed management visibility
- Provider scheduling alignment with actual daily and weekly demand patterns
- Early identification of throughput bottlenecks before they compound
Key Use Cases: Where Healthcare Analytics Delivers Operational Impact
Healthcare analytics applies across the full clinical operations spectrum — from front-desk scheduling and care team coordination to post-discharge follow-up and compliance reporting.
Staffing and Workforce Planning
Analytics enables data-driven staffing decisions by modeling patient volume trends against provider availability, identifying coverage gaps before they affect care delivery, and reducing unplanned overtime costs.
The stakes are highest for rural health organizations running lean MD and NP/PA teams. Each physician vacancy costs an estimated $200,000+ per month in lost revenue against an average $2.4 million in annual physician-generated revenue — a single vacancy can disrupt entire service lines.
HealthFront Ventures addresses this directly through AI-native HCP workforce data baselines, including HealthFront Baseline™, which gives rural healthcare organizations quantitative benchmarks for workforce conditions and gap planning without requiring custom data infrastructure builds.
Patient Flow and Bed Management
Patient flow analytics tracks admissions, discharges, transfers, and wait times in near-real time. Hospitals use this data to optimize bed assignments, reduce bottlenecks in emergency and surgical units, and improve throughput without requiring additional physical capacity.
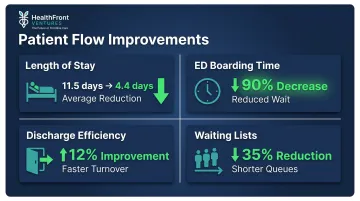
Research on patient flow interventions demonstrates measurable results:
- Average length of stay reduced from 11.5 to 4.4 days
- ED boarding time decreased by 90%
- Discharge efficiency improved by 12% using real-time location systems
- Waiting lists reduced by 35% with multi-ED optimization models
Taken together, these gains represent substantial throughput improvements without capital investment in new beds or facilities.
Readmission Reduction and Care Transitions
Predictive models identify high-risk patients before discharge, giving care teams the data needed to intervene with targeted follow-up plans. A predictive analytics program across 21 hospitals achieved a 2.5% absolute risk reduction in readmissions. Approximately 40 patients needed to be enrolled in the intervention program to prevent one readmission.
The financial stakes under value-based care contracts are significant. 79% of U.S. acute care hospitals were penalized under the CMS Hospital Readmissions Reduction Program in FY2017, totaling $528 million in penalties — making analytics-driven readmission reduction a direct lever on both patient outcomes and revenue.
Financial and Claims Optimization
Analytics tracks billing patterns, identifies coding errors before claims submission, surfaces denial trends, and informs payer contract negotiations — improving billing turnaround and net revenue capture while reducing revenue leakage.
Hospitals lose 3% to 5% of net revenue annually to billing inefficiencies and underpayments, with payer denial tactics imposing a $20 billion financial impact industry-wide.
At one Midwest health system, analytics-driven denial prediction captured $40 million in additional net revenue in a single year — improving first-pass yield from 85% to 92% and cutting denial rates by 18–19%.
Quality and Compliance Monitoring
Analytics supports ongoing compliance with quality benchmarks — HEDIS scores, Star Ratings — by surfacing care gaps in real time and enabling organizations to take corrective action before reporting deadlines.
Medicare Advantage quality bonus payments totaled at least $12.7 billion in 2025, averaging $372 per enrollee, with 75% of enrollees in plans rated 4 stars or above. HEDIS-aligned analytics directly affects plan revenue by closing care gaps before they hit rating calculations.
The Benefits of Healthcare Analytics for Clinical Operations
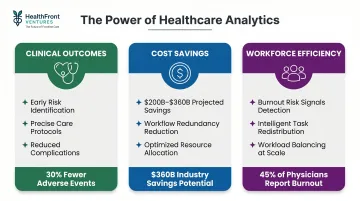
Healthcare analytics delivers measurable value across three interconnected areas: patient outcomes, cost structure, and the workforce itself.
Improved clinical outcomes: Earlier identification of at-risk patients, more precise care protocols, and population-level health management reduce preventable complications, hospital-acquired conditions, and care variation across providers.
Operational cost savings: Analytics surfaces workflow redundancies, unnecessary procedures, supply chain waste, and staffing inefficiencies. AI, machine learning, and deep learning are projected to generate $200 billion to $360 billion in net healthcare savings — a figure that underscores the financial stakes of acting on available data.
Workforce efficiency: Analytics identifies which administrative tasks can be redistributed across the care team based on licensure and workload data — directly reducing clinician burden. Physician burnout reached 45% in early 2024, with clinicians logging 1-2 hours of after-hours EHR work nightly.
For rural organizations, this matters beyond efficiency. Workload visibility becomes a retention lever — surfacing burnout risk signals before they drive turnover in communities that can least afford provider vacancies.
Challenges in Implementing Healthcare Analytics
Data Quality and Integration
Healthcare data is often siloed across incompatible systems, inconsistently coded, or incomplete — particularly in rural and safety-net settings with limited IT infrastructure. Only 52% of independent hospitals used FHIR APIs for patient access in 2022 — far below rates at system-affiliated hospitals. Reliable cross-system analysis requires purpose-built, interoperable data architecture that most rural organizations don't yet have.
Regulatory and Ethical Compliance
Organizations must navigate HIPAA de-identification requirements, which offer two paths: Expert Determination (a qualified expert confirms re-identification risk is "very small") or Safe Harbor (removal of 18 specific identifier categories, such as names, sub-state geographic data, and precise dates).
Separately, FDA guidance on Clinical Decision Support software requires algorithmic transparency — clinicians must be able to independently review the basis for any recommendation. Compliance needs to be built into the design from day one, not retrofitted after deployment.
Change Management and Adoption
Analytics tools fail when clinical staff distrust the outputs or lack the literacy to act on them — regardless of how well the underlying model performs. Successful adoption depends on a few non-negotiable elements:
- Executive sponsorship to signal organizational commitment
- Phased rollout that lets teams adapt without disruption
- Clinical champions who bridge data teams and care providers
Without these, even accurate insights go unused.
Conclusion
Healthcare analytics structures the data environment around clinical judgment. When operational and care decisions are consistently grounded in evidence, the result is better patient outcomes and more sustainable organizational performance.
For rural healthcare organizations navigating provider shortages, lean operational budgets, and limited data infrastructure, the path forward begins with reliable baseline workforce data. 46% of rural hospitals operate with negative margins, and 432 are vulnerable to closure. For these organizations, analytics-driven operational efficiency is not a strategic nice-to-have. It's a survival requirement.
HealthFront Baseline™ gives rural health systems a ready-made data foundation — quantitative workforce metrics, AI-native infrastructure, and structured retention and recruiting planning — without the cost or complexity of building custom data systems from scratch.
Frequently Asked Questions
What does healthcare analytics do?
Healthcare analytics collects and analyzes health data to identify patterns, improve clinical decision-making, optimize care delivery workflows, and reduce operational and financial waste across healthcare organizations.
What is operational efficiency in healthcare?
Operational efficiency in healthcare means delivering the highest quality patient care with the fewest unnecessary resources, measured through metrics like patient throughput, staff utilization rates, average wait times, and cost per clinical encounter.
What does a healthcare operations analyst do?
A healthcare operations analyst collects and interprets data on staffing levels, patient flow, billing performance, and quality measures — then translates those findings into actionable process improvement recommendations for clinical and administrative leadership.
What is an example of operational analytics in healthcare?
A hospital applies predictive analytics to forecast emergency department volume by day and shift, then adjusts nurse staffing schedules proactively to reduce patient wait times and avoid unplanned overtime costs.
What are the types of healthcare analytics?
There are five types, each enabling more advanced decision-making than the last:
- Descriptive — summarizes past events
- Diagnostic — explains why they happened
- Predictive — forecasts what will happen
- Prescriptive — recommends specific actions
- Discovery — uncovers previously unknown patterns
What are the biggest challenges in implementing healthcare analytics?
The three primary barriers are data silos and integration complexity, HIPAA compliance requirements, and clinical staff adoption resistance. Rural organizations face additional hurdles from limited IT infrastructure and smaller usable data volumes.