
Introduction
Healthcare decision-makers face mounting pressure to justify every clinical, operational, and workforce choice with hard evidence—not gut instinct or anecdotal experience. A recent HRSA projection paints a stark picture: 58% physician shortage in nonmetro areas by 2038, compared to just 5% in metro regions. Meanwhile, 28.7% of all healthcare workers plan to leave their jobs within two years, with that figure rising to 41% among nurses. These numbers demand immediate, data-driven action.
Quantitative analysis turns that data-driven imperative into concrete answers: which care protocols actually work, which counties face the steepest provider shortages, and which retention strategies deliver measurable results.
This guide covers what quantitative analysis in healthcare is, why it matters, how it works in practice, and where it creates the most impact. The focus is rural settings, where every staffing decision can mean the difference between access and abandonment.
Key Takeaways
- Quantitative analysis applies numerical data and statistical methods to answer measurable healthcare questions—from patient outcomes to workforce gaps
- Core methods include descriptive statistics, regression, clinical trials, epidemiological studies, and medical record analysis
- Clinical decisions, resource allocation, and policy design all improve when grounded in real numbers rather than assumption
- In rural healthcare, it's critical for tracking provider availability, identifying retention risks, and justifying workforce investments
- Following a structured process—clear objectives, sound methods, and action on findings—turns raw data into decisions that stick
What Is Quantitative Analysis in Healthcare?
Quantitative analysis in healthcare is the systematic use of numerical data and statistical methods to measure, monitor, and interpret health-related phenomena. It answers "how many," "how much," and "how often" using numbers, statistical significance, and reproducible methods. Quantitative research relies on statistical analyses to test hypotheses and identify causal relationships, underpinning both clinical and operational decisions.
Where it's used:
- Clinical research — randomized controlled trials (RCTs), cohort studies
- Health informatics — EHR data extraction, population health management
- Hospital operations — capacity planning, readmission tracking, length-of-stay analysis
- Quality improvement — measuring baseline performance, tracking intervention outcomes
- Healthcare workforce planning — analyzing provider supply, turnover rates, vacancy trends, FTE requirements
Each of these applications depends on one core trade-off: quantitative methods deliver high reliability and generalizability, but they can miss contextual nuance that numbers alone can't capture. Qualitative analysis — built on interviews, observations, and thematic interpretation — fills that gap, though it sacrifices generalizability in return. The table below maps out the key differences.
Quantitative vs. Qualitative: A Quick Comparison
| Dimension | Quantitative | Qualitative |
|---|---|---|
| Data Type | Numerical, measurable values | Narrative (words, images) |
| Methods | Surveys, statistical tests, experiments | Interviews, observation, focus groups |
| Outputs | Statistics, trends, correlations | Themes, insights, experiences |
| Best Use Cases | Measuring effectiveness, forecasting outcomes | Patient experience, motivations, context |
Why Quantitative Analysis Is Critical in Healthcare
Healthcare systems operate in a high-stakes environment where decisions about treatment protocols, staffing models, and resource allocation directly affect patient safety and organizational viability. Quantitative analysis provides the objective foundation for those decisions—replacing reactive guesswork with measurable evidence.
Core operational benefits:
- Quantifies which interventions actually work, drawing on clinical trials and outcome data
- Predicts adverse outcomes—readmissions, patient deterioration—before they occur
- Measures utilization, demand, and service gaps to align staffing with actual need
- Establishes baselines and tracks quality improvement progress using standardized metrics
- Tracks provider availability, turnover rates, and supply gaps—particularly in rural counties facing chronic shortages
- Delivers the documented, reproducible metrics required for accreditation, CMS quality programs, and grant applications
Without structured quantitative frameworks, healthcare organizations default to reactive decisions that fail to anticipate demand or track impact. Evidence-based practice has been consistently linked to improved quality of care, patient safety, and positive clinical outcomes, and quantitative methods underpin the research process that EBP depends on.
The regulatory environment adds direct financial stakes. The CMS Hospital Readmissions Reduction Program, established in 2012, imposes penalties of up to 3% of total inpatient Medicare revenue based on quantitative 30-day readmission rates.
In FY2017 alone, 79% of acute care hospitals were penalized, generating $528 million in withheld revenue. For most organizations, outcome tracking is no longer optional—it is a financial survival requirement.

Key Methods of Quantitative Analysis in Healthcare
The right method depends on the research question, available data, and desired outcome. Healthcare analysts often combine multiple methods in a single study — pairing high internal validity with broader real-world applicability.
Descriptive Statistics
Descriptive statistics — mean, median, mode, standard deviation — summarize raw data to reveal patterns. Common examples include:
- Average patient wait times by facility or department
- Readmission frequencies across care transitions
- Provider-to-patient ratios in a county or region
Every deeper analysis begins here. Descriptive stats establish what the data shows before any modeling begins.
Inferential Statistics and Hypothesis Testing
Inferential methods (t-tests, ANOVA, chi-square) allow analysts to draw conclusions about a larger population from a sample. For example, testing whether a new care protocol significantly reduces readmission rates compared to the existing standard. These methods confirm whether observed differences are statistically meaningful or simply due to chance.
Regression Analysis
Regression identifies relationships between variables—such as how staffing levels, communication quality, or appointment wait times predict patient satisfaction scores. Machine learning models applied to workforce data identified income as the #1 predictor and rural upbringing as #2 for rural practice location choice — showing how regression exposes which variables actually drive decisions, not just which ones correlate with them.
Clinical Trials and Epidemiological Studies
Randomized controlled trials (RCTs) test intervention effectiveness with high internal validity by isolating causal relationships under controlled conditions. Epidemiological studies track disease patterns and risk factors at the population level, offering broader generalizability but less control over confounding variables. A meta-analysis of 25 RCTs with 105,527 participants demonstrated mRNA COVID-19 vaccine efficacy of 94.6% (95% CI: 93.6-95.4%), exemplifying quantitative analysis at its most rigorous.
Quantitative Analysis of Medical Records
This involves systematic review of coded clinical documentation to extract numerical data — diagnosis frequencies, procedure counts, medication patterns, and length-of-stay metrics. With 96% of non-federal acute care hospitals and 78% of office-based physicians now using certified EHRs, the data infrastructure is there.
Healthcare systems apply this method to quality audits, compliance checks, utilization reviews, and population health reporting — making it one of the most operationally versatile forms of quantitative analysis available.
How Quantitative Analysis Works in Healthcare – Step by Step
The most common failure points in quantitative analysis aren't technical—they're process-based: skipping objective definition, using poorly cleaned data, or generating insights that never translate into decisions. Here's the practical framework applied in real-world healthcare settings.
Step 1 – Define the Objective
Identify the specific health question, operational problem, or policy decision driving the analysis. Examples: "What factors predict 30-day readmission?" or "Which rural counties have the highest NP vacancy rates?" This step controls scope, aligns stakeholders, and ensures the analysis addresses a decision that matters.
Step 2 – Identify and Gather Data
Determine what data sources are needed—EHR records, claims data, workforce registries, survey responses, public health datasets—and collect them systematically. Completeness and coverage directly impact analysis reliability.
Step 3 – Clean and Prepare the Data
This step is commonly rushed, which produces skewed or misleading outputs. Before any analysis begins, teams should:
- Remove duplicate records and resolve conflicting entries
- Address missing values through imputation or documented exclusion
- Standardize formats and validate coding accuracy across sources
Step 4 – Apply the Appropriate Statistical Method
Select and run the method suited to the objective: descriptive summary, regression model, significance test, trend analysis, or predictive model. A workforce vacancy question calls for different tools than a readmission risk model—method selection is where analytical rigor either holds or breaks down.

Step 5 – Interpret the Results
Translate statistical outputs into meaningful findings for the target audience. Avoid overinterpreting correlations as causation and underreporting significant trends. Common pitfalls include:
- Ignoring confidence intervals when reporting effect sizes
- Misreading p-values as absolute proof rather than probabilistic evidence
- Presenting findings without context for the decision-maker's actual question
Step 6 – Act and Review
Use insights to drive specific decisions:
- Adjust staffing models or recruitment incentive structures
- Redesign care protocols based on outcome patterns
- Reallocate resources toward high-need rural counties or provider categories
Schedule a review cycle to measure whether the intervention produced the expected change. If outcomes don't shift, that gap itself becomes the next analytical objective.
Quantitative Analysis in Healthcare: A Practical Walkthrough
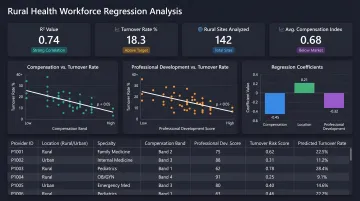
Here's how a structured quantitative analysis plays out in practice. A rural health system notices rising provider turnover but lacks clarity on which locations, roles, or contract types are most affected — so they build a data-driven case from scratch.
Objective: Identify top predictors of provider turnover
Data gathered: HR records, contract data, county-level vacancy rates, salary benchmarks
Cleaning: Standardize role classifications, remove duplicate provider entries, validate county assignments
Method: Regression analysis to identify which variables correlate most strongly with turnover
Output reveals: NPs in specific rural counties with below-average compensation and limited professional development opportunities have the highest 18-month attrition. Gender, race, and debt levels show no significant correlation. A peer-reviewed study on rural physician retention confirms this pattern, finding income as the strongest predictor of rural retention, followed by rural upbringing — with the model achieving approximately 80% accuracy.
Decision: The health system implements targeted retention bonuses for NPs in high-risk counties and establishes a continuing education stipend program. They schedule quarterly reviews to measure attrition trends in the intervention cohort.
Structured quantitative analysis makes this kind of targeted response possible. Without it, health systems often apply broad retention programs that miss the populations most at risk — spending resources without shifting outcomes.
How HealthFront Ventures Can Help
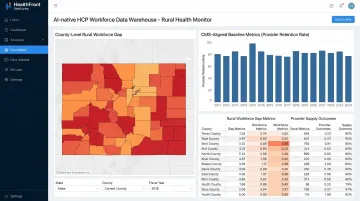
HealthFront Ventures builds AI-native workforce data infrastructure specifically for rural healthcare provider retention and recruitment. The organization offers pre-built, outsourced AI-Native HCP Workforce Data Warehouses and Lakes that transform raw workforce and claims data into workforce gap insights — eliminating the need for rural health systems to build custom data infrastructure from scratch.
HealthFront Baseline™ — launching Q1 2026 — is a purpose-built quantitative framework for rural health organizations. It features 4 quantitative workforce metrics plus 1 Rural County Quality Measure, giving state-level programs a standardized starting point for tracking, comparing, and improving HCP workforce data.
The framework integrates Medicare and Medicaid claims data at the NPI level with geographic identifiers. This enables gap analysis, value-based care program design, and performance measurement without requiring internal claims infrastructure.
Specific outcomes HealthFront Ventures is designed to support:
- Structured retention and recruiting incentive plans for rural NP/PA workforces
- Predictive modeling and utilization-based strategies to guide NP/PA expansion decisions
- CMS-aligned FY25 baseline metrics for tracking rural health transformation outcomes
Rural health organizations that lack internal data teams can use these frameworks to begin quantitative workforce planning in Q1 2026 without waiting to build proprietary infrastructure.
Conclusion
Quantitative analysis in healthcare isn't just a research tool—it's the operating foundation for every evidence-based decision, from clinical protocols to workforce strategy. Organizations without structured data processes are consistently behind the curve, reacting to crises rather than anticipating them. With HRSA projecting only 68% of demand for rural primary care will be met by 2037, the cost of reactive decision-making is measured in widening access gaps and preventable exits.
Quantitative analysis delivers the most value as an ongoing discipline, not a one-time reporting exercise. That means regular review cycles, updated data sources, and clear connections between metrics and real decisions. The six-step process outlined here provides a repeatable framework rural health organizations can put to work immediately:
- Workforce planning: Track HCP supply and demand by county to get ahead of shortages
- Retention strategy: Use turnover and tenure data to identify where intervention is needed most
- Quality improvement: Link provider ratios and access metrics to patient outcome trends
- Program measurement: Establish baselines before transformation initiatives launch, then measure against them
The organizations that close the rural care gap won't be the ones that collected the most data—they'll be the ones that acted on it consistently.
Frequently Asked Questions
What is quantitative analysis in healthcare?
Quantitative analysis in healthcare is the use of numerical data and statistical methods to measure health outcomes, test hypotheses, identify trends, and inform evidence-based decisions across clinical, operational, and workforce domains. It provides the measurable foundation for everything from vaccine effectiveness studies to provider retention modeling.
What are the steps in the quantitative analysis process in healthcare?
The process moves through six stages: defining the objective, gathering data, cleaning and preparing data, selecting the right statistical method, interpreting results, and acting on insights with a built-in review cycle. Organizations that skip data cleaning or the action/review phase consistently produce unreliable or unused analyses.
What are the main methods of quantitative analysis in healthcare?
Core methods include:
- Descriptive statistics (mean, median, standard deviation)
- Inferential statistics (t-tests, ANOVA, chi-square)
- Regression analysis and randomized controlled trials (RCTs)
- Epidemiological studies and quantitative medical record review
Method selection depends on the research question, data structure, and desired level of causal inference.
What are examples of quantitative analysis in healthcare?
Common examples include:
- Measuring mRNA vaccine efficacy at 94.6% across 105,527 trial participants
- Tracking hospital readmission rates under CMS quality programs
- Analyzing provider vacancy rates in rural counties via workforce registries
- Assessing telehealth outcomes through patient survey data
What is quantitative analysis of medical records?
Quantitative analysis of medical records involves extracting and analyzing coded clinical data—diagnoses, procedures, medications, and length of stay—for quality audits, compliance reporting, and population health work. With 96% hospital EHR adoption, it draws on structured data already generated through routine care.
What is the difference between qualitative and quantitative analysis in healthcare?
Quantitative analysis measures numerical, statistically testable data to answer "how many" or "how much," while qualitative analysis explores experiences and meanings through narrative methods to answer "why" and "how." Both are often used together — quantitative data captures outcomes, qualitative data explains the experience behind them.